Portfolio Noah Vawter:
Perfect Harmonic Intervals
After reading Rameau's
A Treatise on Harmony, I became interested in the concept of perfect harmonic ratios
in the context of musical composition. The ideas are brilliant, however,
I felt the author described them too obscurely. For example, he never
presents all intervals in a single diagram, demonstrating their relationship.
Therefore, in order to understand and communicate the ideas better, I re-organized
them.
Harmonic Grid
In this representation, each block contains the interval name, its perfect
harmonic derivation, the decimal equivalent of that ratio, and the traditional
note name. The arrangement of the intervals indicates their relationship to
each other. Intervals along the diagonal axis which runs northeast-southwest
are all related by powers of 5. Intervals along the perpendicular axis are
related by powers of 2. Octaves are implied.
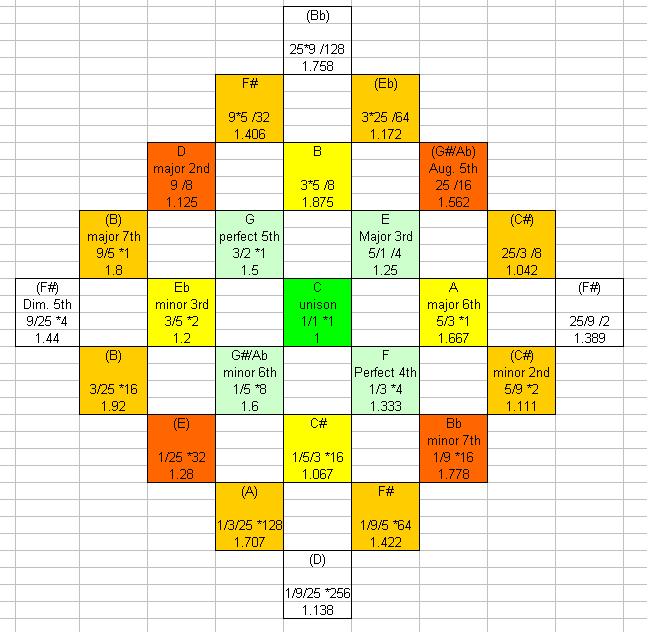 As you're looking at this, try to observe the relationships between
some intervals with which you're familiar. For example, notice
the organization and proximity of the notes in a C major chord. Compare it with
the notes in a G major chord. They both make a "V" shape. Notice how
the two V's are related by factor of 3. This illustrates the relationship
of 3/2 to the C and G: the pitch of G is 3/2 times that of C. (Since this
chart is only 2-dimensional, it can not account for the factor of two, you
must track the octaves yourself. However, I am planning an art piece
which is based on a 3-dimensional version of this chart.)
As you're looking at this, try to observe the relationships between
some intervals with which you're familiar. For example, notice
the organization and proximity of the notes in a C major chord. Compare it with
the notes in a G major chord. They both make a "V" shape. Notice how
the two V's are related by factor of 3. This illustrates the relationship
of 3/2 to the C and G: the pitch of G is 3/2 times that of C. (Since this
chart is only 2-dimensional, it can not account for the factor of two, you
must track the octaves yourself. However, I am planning an art piece
which is based on a 3-dimensional version of this chart.)
Why 12-tones?
In this picture, I explore why we have 12-tone chromatic scales as
a standard. On the left side, I list Rameau's perfect harmonic
intervals. I give their origins and decimal equivalents. Then,
in the next 24 columns, I generate chromatic scales with varying
numbers of degrees, and try to find the closet possible interval
in them to match the perfect harmonic interval. For example,
a chromatic scale with 5 notes per octave really has to stretch
to hit the range of values between 1.000 and 2.000. It has
a decent percentage of error (< 2%) for some intervals, such as 175/128
and 3/2. However, when it tries to approximate C#, whose perfect
harmonic ratio is 16/15, a 5-tone scale can only get within 6.25%.
Also, it has large errors for many other intervals. You can
see that it's Average Percent Error is 3.768%, with the worst case
over 9%. In other words, totally unacceptable musically.
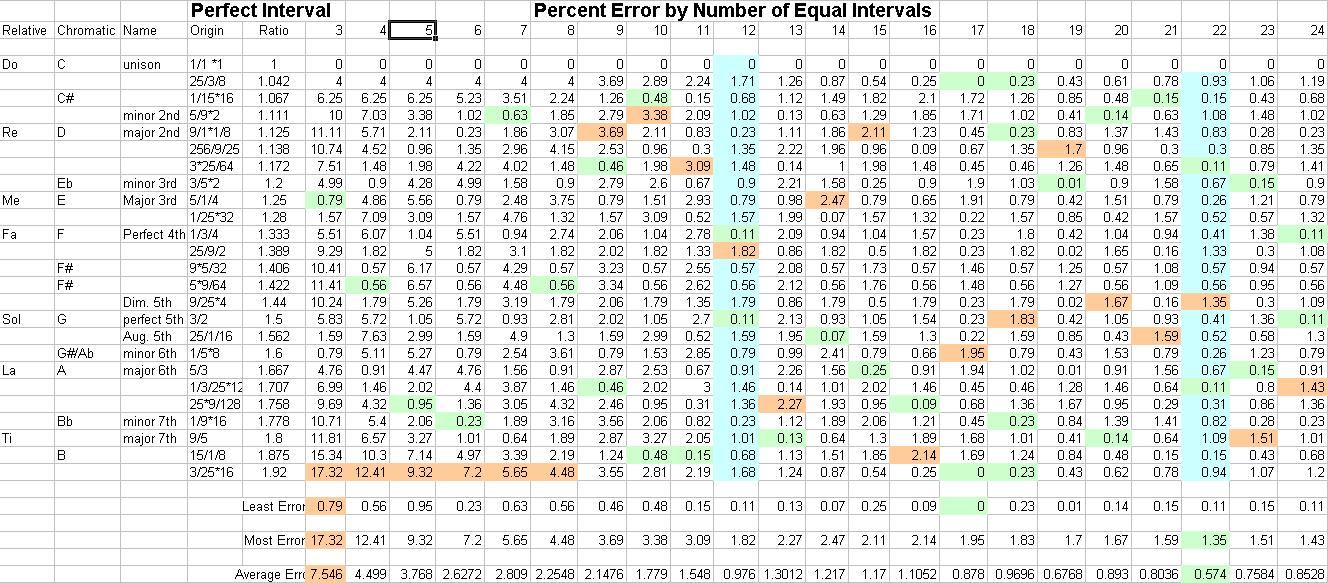
So, an obvious engineering problem is, "What is the minumum number
of intervals we can use in a scale and have it sound decent?"
When you look at this spreadsheet, especially the "Most Error"
row, you'll see that every scale with less than 11 intervals fails.
It's only at 12 that a scale acheives less than 2% error.
What's even more interesting is that using 13 intervals
results in no improvement,in fact, it's much worse! A 13 interval
chromatic scale can, at best, represent perfect intervals with 2.27%
error. A 14-interval chromatic scale is even worse.
In fact, 15 and 16 step scales are bad, too. It's only when you
reach 17 intervals that the results get acceptable again. So,
12 intervals is a very wise choice for a number of chromatic
steps.
Another interesting observation is the local minimum
at 22 steps. That means 20, 21, 23 and 24 are worse than 22.
What's the significance? It turns out that another major music
system, the Eastern Indian scale, uses 22 chromatic intervals.
Coincidence? or design?
Video Game Chip Music Scale
Once again, you can spot Rameau's perfect intervals
on the left columns. What's in the middle? Register
settings for TIA, the Atari 2600 soundchip. Then, on
the right, I determined the percent error settings
between the perfect harmonic interval and the TIA
chip setting.
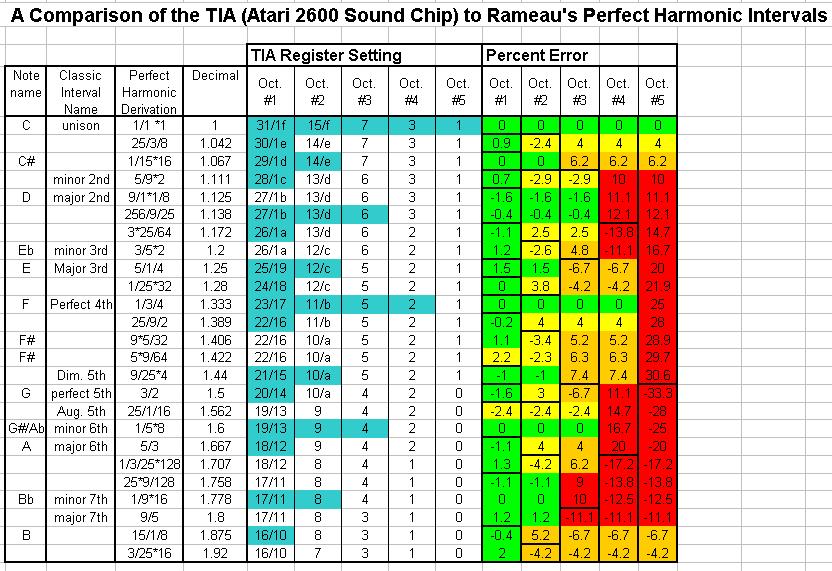
In a book I'll one day write, I'll bring this to
a radical conclusion: That video
game music is as more harmonically perfect than the piano.
Links